Building and Deploying a Robust Monitoring Solution for your Applications

In our previous post on Monitoring Fundamentals, we covered the theoretical aspects of monitoring, including the Four Golden Signals and the importance of metrics and alerting in maintaining reliable systems. Now, let's put that knowledge into practice by building and deploying a complete monitoring stack.
Introduction
This guide builds upon our existing repository used throughout the "52 Weeks of SRE" blog series, which is based on the excellent go-base template. We'll work on enhancing this service with comprehensive monitoring capabilities using industry-standard tools.
Prerequisites
- Docker and Docker Compose
- Basic understanding of Go programming (although the concepts applied here are easily interchangeable between different languages and frameworks)
- Understand the basics of Monitoring Fundamentals
1. Setting Up the Infrastructure
First, let's set up our monitoring infrastructure using Docker Compose. Let's update the existing docker-compose.yml file on our repository by adding Prometheus (our metrics collector) and Grafana (our visualization platform):
version: '3.8'

services:
  // Existing services remaing the same...

  prometheus:
    image: prom/prometheus:latest
    ports:
      - "9090:9090" # Exposes Prometheus on port 9090
    volumes:
      - ./prometheus/prometheus.yml:/etc/prometheus/prometheus.yml
    command:
      - '--config.file=/etc/prometheus/prometheus.yml'

  grafana:
    image: grafana/grafana:latest
    ports:
      - "3000:3000" # Exposes Grafana on port 3000
    depends_on:
      - prometheus
Now we need to create the Prometheus configuration file referenced above. Create a new file at config/prometheus/prometheus.yml, and add the following contents:
global:
  scrape_interval: 15s

scrape_configs:
  - job_name: 'go-service'
    static_configs:
      - targets: ['server:8080']
With this configuration file, we're defining through scrape_interval that Prometheus will fetch metrics at intervals of 15 seconds, and we've added our Golang service to scrape_configs, setting a unique job_name to it, which we'll use to filter metrics for this service, and finally a target where Prometheus will fetch metrics from.
By default, Prometheus expects metrics to be served at the /metrics endpoint. If you need to expose them at a different endpoint, you can set the metrics_path configuration as such:
(...)
scrape_configs:
  - job_name: 'go-service'
    metrics_paths: '/subpath/custom-metrics`
(...)
2. Instrumenting the Go Service
Let's add monitoring capabilities to our Go service. First, we need to install the required Prometheus dependencies:
go get github.com/prometheus/client_golang/prometheus
go get github.com/prometheus/client_golang/prometheus/promauto
go get github.com/prometheus/client_golang/prometheus/promhttp
These dependencies give us the ability to produce metrics, and expose them through an HTTP API, where Prometheus will scrape from.
Now let's create a new metrics package and metrics.go file, which will handle our instrumentation. We'll create the Four Golden Signal metrics: Duration, Traffic, Errors, and Saturation. Create a new file under metrics/metrics.go:
// metrics/metrics.go
package metrics

import (
	"github.com/prometheus/client_golang/prometheus"
	"github.com/prometheus/client_golang/prometheus/promauto"
)

var (
	// RequestDuration handles the Latency histogram metric
	RequestDuration = promauto.NewHistogramVec(
		prometheus.HistogramOpts{
			Name:    "http_request_duration_seconds",
			Help:    "Request duration in seconds",
			Buckets: []float64{.005, .01, .025, .05, .1, .25, .5, 1, 2.5, 5, 10},
		},
		[]string{"handler", "method", "status"},
	)

	// RequestsTotal handles the Traffic counter metric
	RequestsTotal = promauto.NewCounterVec(
		prometheus.CounterOpts{
			Name: "http_requests_total",
			Help: "Total number of HTTP requests",
		},
		[]string{"handler", "method", "status"},
	)

	// ErrorsTotal handles the Error rate counter metric
	ErrorsTotal = promauto.NewCounterVec(
		prometheus.CounterOpts{
			Name: "http_errors_total",
			Help: "Total number of HTTP errors",
		},
		[]string{"handler", "method", "status"},
	)

	// ConcurrentRequests handles the Saturation metric
	ConcurrentRequests = promauto.NewGauge(
		prometheus.GaugeOpts{
			Name: "http_concurrent_requests",
			Help: "Number of concurrent HTTP requests",
		},
	)

	// SignupsTotal handles the Counter metric tracking total signups
	SignupsTotal = promauto.NewCounterVec(
		prometheus.CounterOpts{
			Name: "signups_total",
			Help: "Total number of signups",
		},
		[]string{},
	)
)
Now we can use the metrics package to start instrumenting our code!
We'll start off by adding the Four Golden Signal metrics to our APIs. For that we can create a new HTTP middleware, which are great for cross-cutting concerns such as monitoring.
Let's start by creating a new middleware.go file under the same metrics package.
// metrics/middleware.go
package metrics

import (
	"net/http"
	"strconv"
	"time"
)

// responseWriter is a custom wrapper for http.ResponseWriter that captures the status code
type responseWriter struct {
	http.ResponseWriter
	statusCode int
}

// WriteHeader intercepts the status code before calling the underlying ResponseWriter
func (rw *responseWriter) WriteHeader(code int) {
	rw.statusCode = code
	rw.ResponseWriter.WriteHeader(code)
}

func Middleware(next http.Handler) http.Handler {
	return http.HandlerFunc(func(w http.ResponseWriter, r *http.Request) {
		start := time.Now()

		// Track concurrent requests
		ConcurrentRequests.Inc()
		defer ConcurrentRequests.Dec()

		// Create a custom response writer to capture the status code
		wrapped := &responseWriter{
			ResponseWriter: w,
			statusCode:     http.StatusOK, // Default to 200 OK
		}

		// Call the next handler with our wrapped response writer
		next.ServeHTTP(wrapped, r)

		// Record metrics after the handler returns
		duration := time.Since(start).Seconds()
		status := strconv.Itoa(wrapped.statusCode)

		RequestDuration.WithLabelValues(
			r.URL.Path,
			r.Method,
			status,
		).Observe(duration)

		RequestsTotal.WithLabelValues(
			r.URL.Path,
			r.Method,
			status,
		).Inc()

		// Record errors if status >= 400
		if wrapped.statusCode >= 400 {
			ErrorsTotal.WithLabelValues(
				r.URL.Path,
				r.Method,
				status,
			).Inc()
		}
	})
}
Now let's work on our remaining metric, which is an application-specific metric for tracking the Total Signups Count. Head over to the api/admin/accounts.go file and, under the create(...) function, add the following line of code:
// api/admin/accounts.go
func (rs *AccountResource) create(w http.ResponseWriter, r *http.Request) {
	// Original code stays the same ...

	metrics.SignupsTotal.WithLabelValues().Inc() // Add this line
	render.Respond(w, r, newAccountResponse(data.Account))
}
Finally, we need update the API server to expose our Prometheus metrics. Open the api/api.go file and add the following line, next to where other middlewares are being set.
// api/api.go
func New(enableCORS bool) (*chi.Mux, error) {
    // Original code ...

    r.Use(middleware.RequestID)
	r.Use(middleware.Timeout(15 * time.Second))
	r.Use(metrics.Middleware) // Add this line

    // Remaining code stays the same ...
}
Remember how we configured Prometheus to fetch metrics from the /metrics endpoint of our application? We must expose this endpoint, which renders all Prometheus metrics.
In the same api/api.go file, make the following changes just before the end of the New() function:
// api/api.go
func New(enableCORS bool) (*chi.Mux, error) {
    // Original code ...

    // Expose Prometheus metrics
    r.Get("/metrics", promhttp.Handler().ServeHTTP) // Add this line
	r.Get("/*", SPAHandler("public"))

    return r, nil
}
Let's review what we have achieved so far:
- Included Grafana and Prometheus in our
docker-compose - Configured Prometheus to fetch metrics from our Golang service through
/metrics - Added instrumentation code to our Golang service, with the Four Golden Signal metrics.
- Exposed these metrics through a
/metricsendpoint, which Prometheus will use for scraping.
3. Configuring Grafana
Now we can move on to the next step, which is configuring Grafana. This is where we'll start to actually see our metrics, and be able to create Dashboards and Alerts.
First make sure you have a fresh stack with docker-compose up -d. Then access Grafana at http://localhost:3000 and login with the default credentials: admin/admin.
Grafana lets you visualize data from a variety of Data Sources. Let's start by adding your Prometheus instance as the first data source on Grafana, so that you can start visualizing and alerting on metrics.
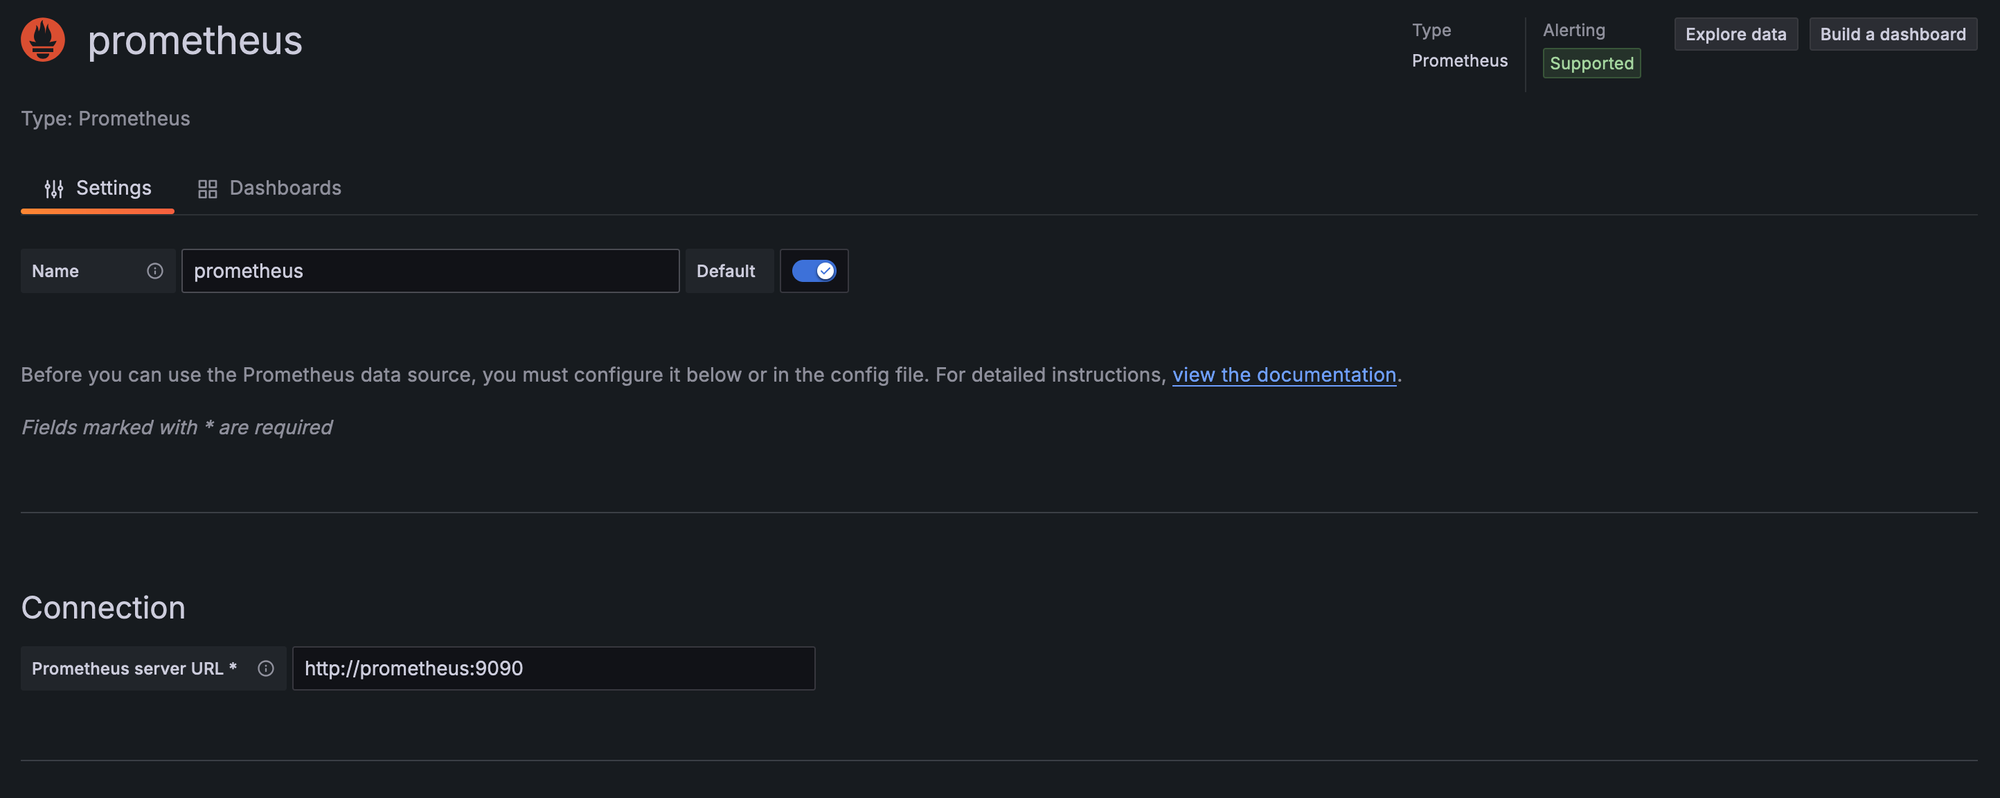
- On the side-menu, go to
Connections -> Data Sources - Click
+ Add data source - Search for "Prometheus" and select it
- Set "Prometheus Server URL" to
http://prometheus:9090 - Click
Save & Test
4. Creating Dashboards
Now that we have connected our data visualization solution (Grafana) to our metrics data provider (Prometheus), let's actually visualize this data by creating a comprehensive dashboard.
- On the side-menu, under "Dashboards", click
+ Create dashboard - Now let's fill this empty dashboard with our Four Golden Signal metrics. Let's start by adding our Traffic metric. First, click on
+ Add visualization - Select the recently configured
prometheusdata source, and now we can define the metric and display options for our latency metric. Let's start by defining the Query:sum(rate(http_requests_total[5m])) by (handler) - Next, let's configure some styling options for our latency visualization for a better user experience. Head to the left-side panel, and let's set the following options:
- Title:
Traffic by Handler - Description:
Monitors the volume of requests per second for each endpoint. - Under "Standard options", set "Unit" to
requests/sec (rps).
- Title:
- Click
Save Dashboardand set a title and description to it.
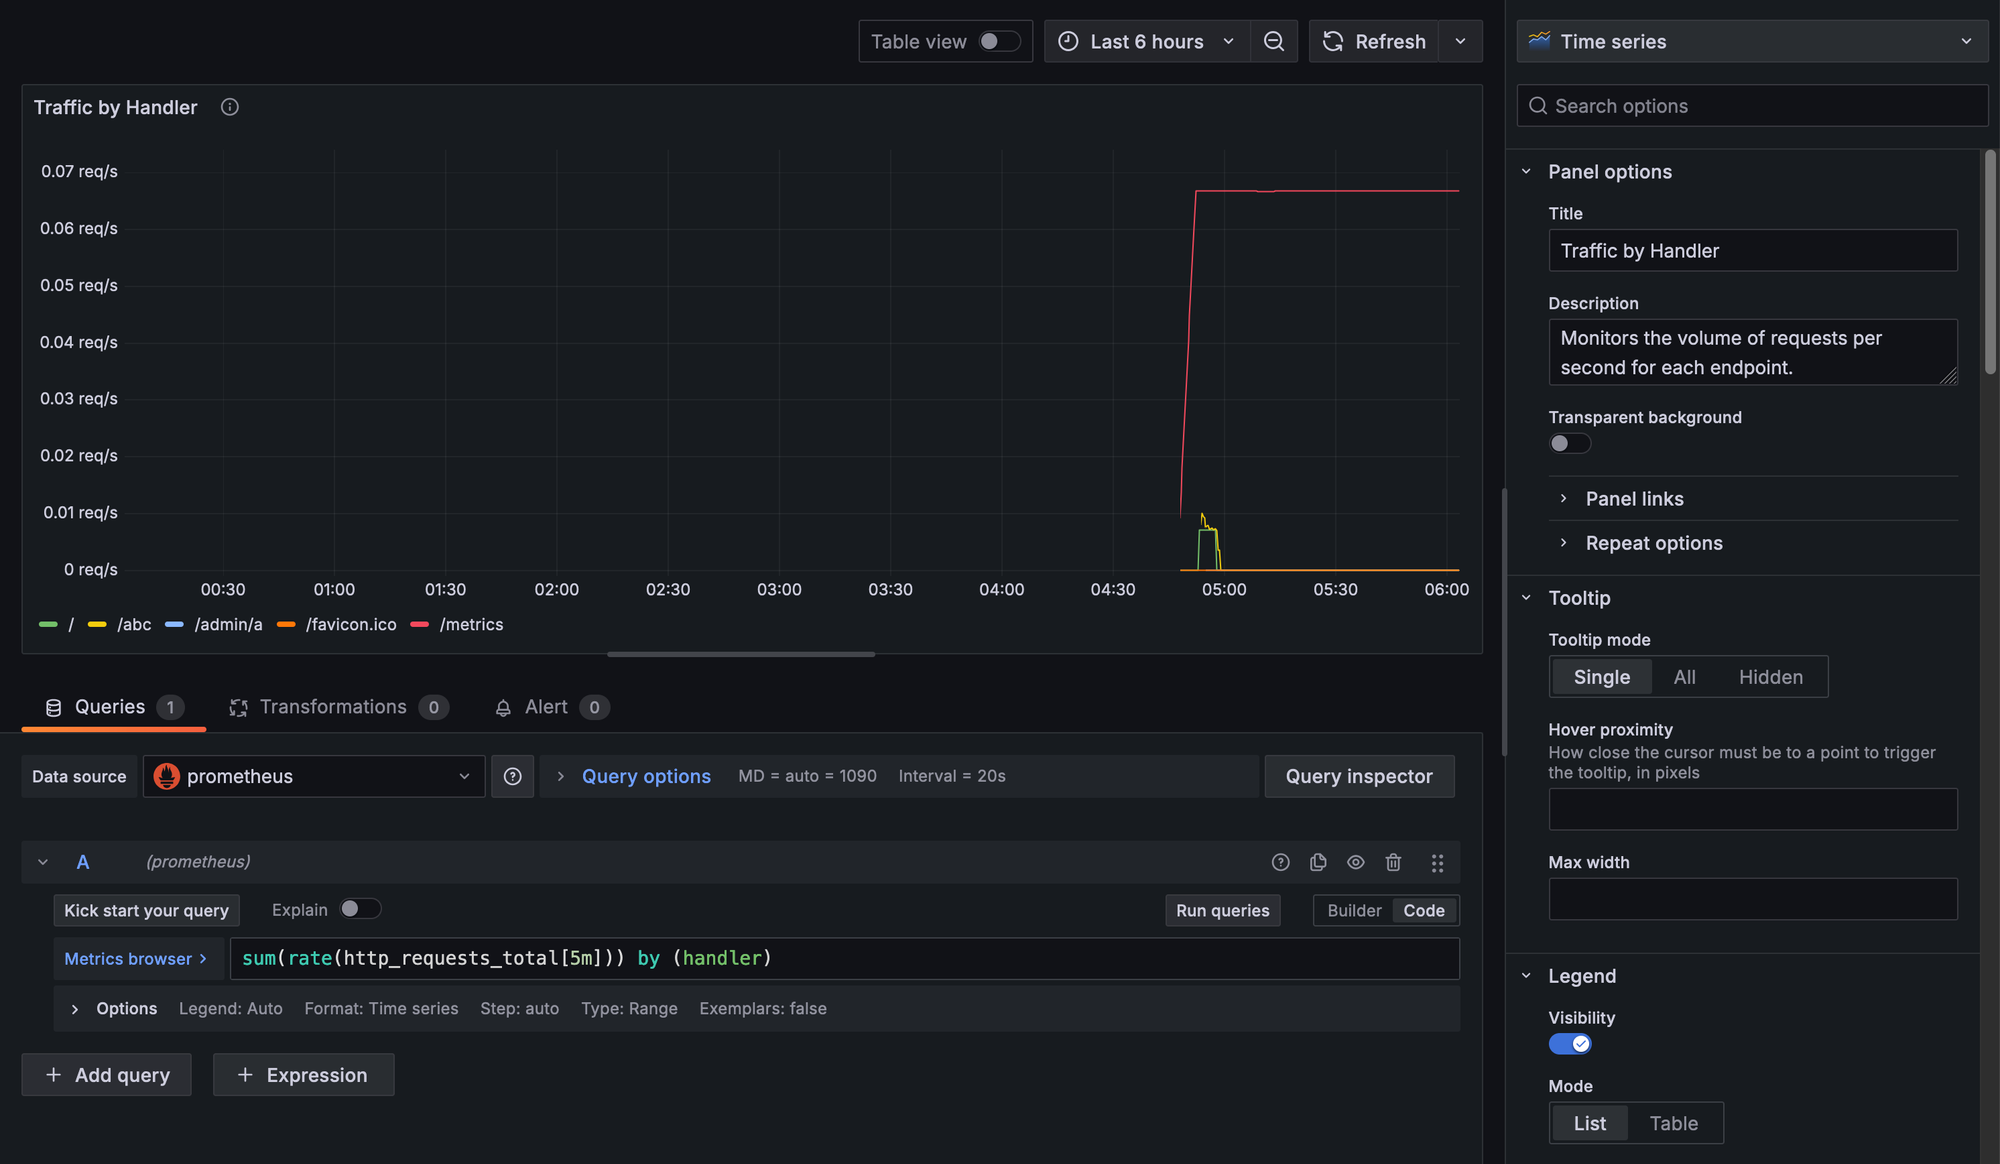
Notice how the /metrics endpoint is reporting around 0.07req/s. This matches our configuration where we set Prometheus to scrape every 15 seconds, which averages out to around 0.07 requests per second!
As an exercise, finish adding panels for each remaining Golden Signal metric: Latency, Error Rate, and Saturation. To get started, click on <- Back to dashboard, then Add -> Visualization.
Finally, create a new "Business Dashboard" and add a new visualization for the "Total Signups" metric. Explore different visualization types, such as Bar Charts and Stats.
Below are the queries we'll be using for each of the remaining metrics. If you want to learn more about querying in Prometheus, head over to their official Querying basics documentation.
Latency Panel (in seconds):
rate(http_request_duration_seconds_sum[5m]) / rate(http_request_duration_seconds_count[5m])Error Rate Panel (in percentage):
(sum(rate(http_errors_total[5m])) / sum(rate(http_requests_total[5m]))) * 100
Saturation Panel (in absolute values):
http_concurrent_requests
Total Signups (in absolute values):
signups_totalI'm also providing the complete Service and Business dashboards implementation through the "52 Weeks of SRE" GitHub repository. It's a good practice to also version control your infrastructure configuration – this is known as Infrastructure as Code (IaC) and we'll cover it on future posts.
You'll notice that the dashboards are defined in a JSON file. You can import them by selecting Import dashboard when creating a new Dashboard in Grafana.

5. Setting Up Alerts
Now let's move on to Alerts. Remember to review in our Monitoring Fundamentals post the best-practices for creating alerts.
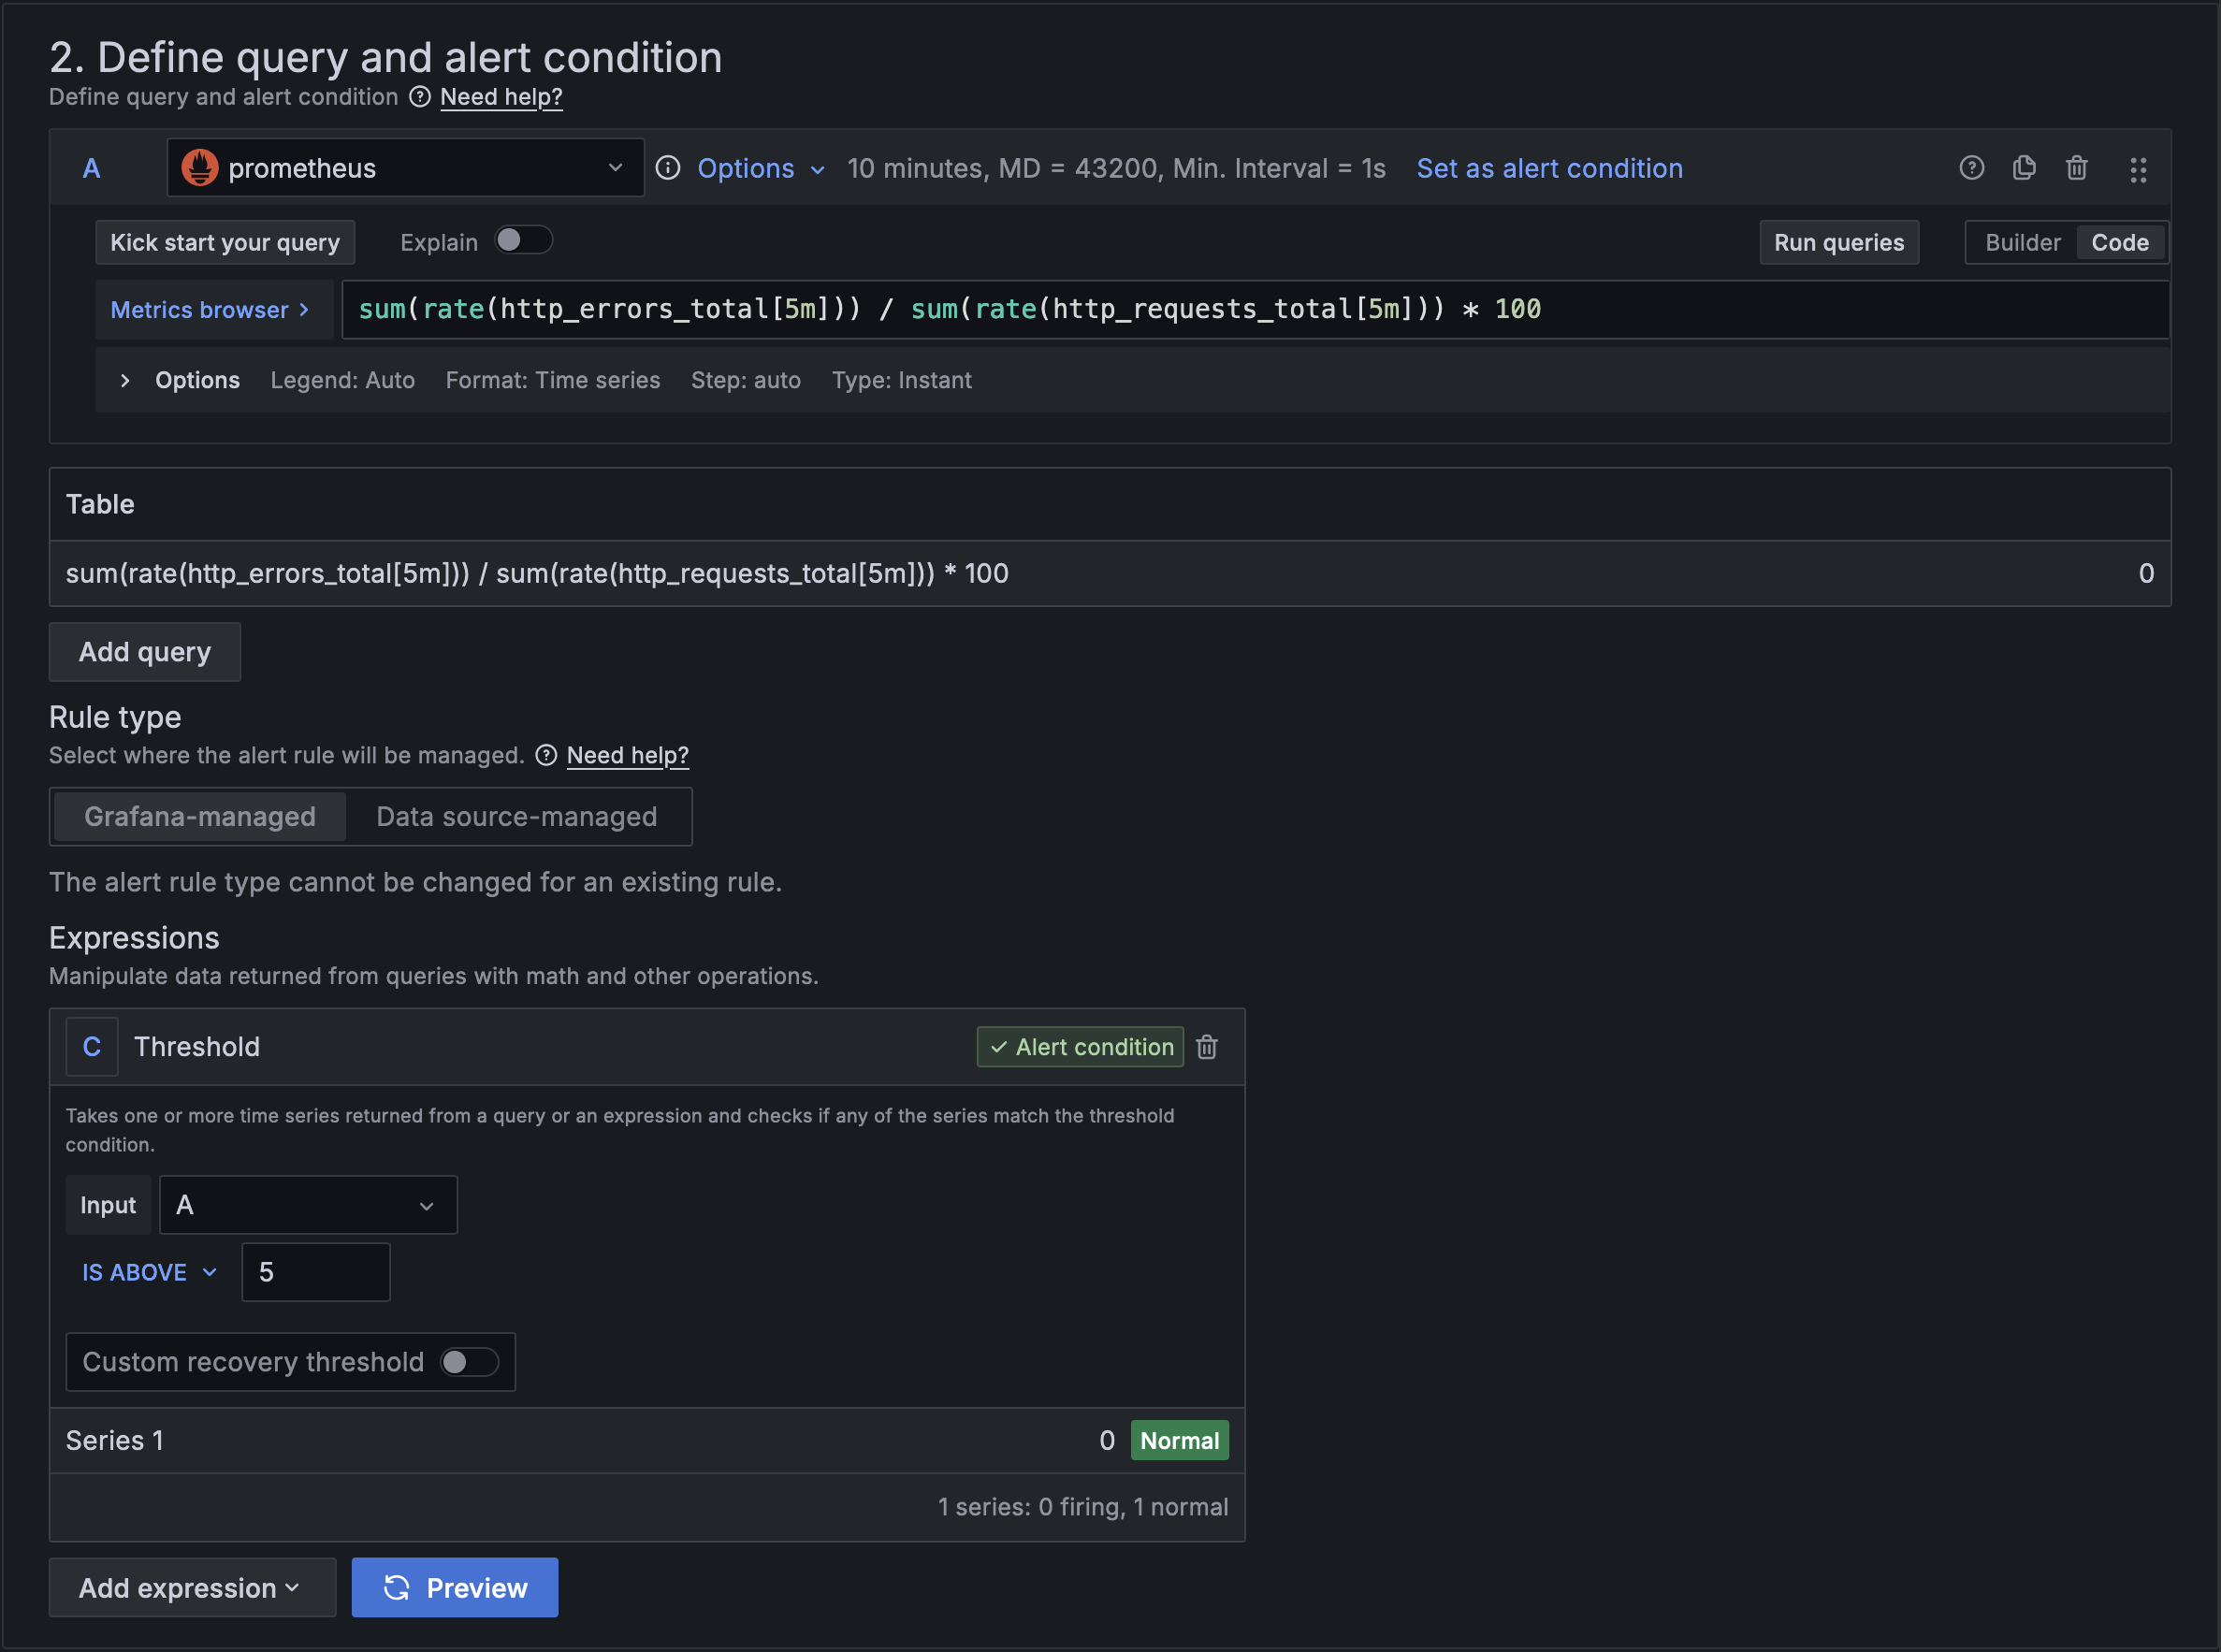
Alert Rules
Let's create a rule that will alert engineers of high error rates on login attempts:
- On the side-menu, under "Alerting", go to "Alert rules", and click on
+ New alert rule. - Now let's configure our alert rule:
- Enter a descriptive name: High Error Rate on Logins (>5%)
- Define the Query that will select the data you want to measure:
(sum(rate(http_errors_total{handler="/auth/login", status=~"5.*"}[5m])) * 100) / sum(rate(http_requests_total{handler="/auth/login"}[5m])). Notice that it's a similar metric to what the one we use to plot the Error Rate visualization in our Dashboard, but we've added some filters to it: first we only want to look at requests for the/auth/loginendpoint, and second we only want to be alerted on server errors (i.e. HTTP Status Code >= 500). - Set the conditions on which to trigger the alert. Under "Expressions", set the "Input" as our query
A, and set the threshold toIS ABOVE 5. - Now define the Interval at which Grafana will evaluate this metric and update the alert status. Let's go for
every 5 minutes. - Add labels and annotations for better context. I decided to define a
context: authlabel, which we can re-use amongst other alerts related to Authorization & Authentication for easier management and grouping of these alerts. - Configure a brief Summary for the alert such as
Logins Error Rate over 5% over the past 5 minutes. Investigate immediately. - Add a thorough description with more context about the alert and issue being reported. Remember what we covered in the Monitoring Fundamentals post about Alert Contexts, so let's work on a helpful message for our fellow engineers who will be looking into this alert:
Severity: Critical
Error Rate: Over 5%
Interval: Pst 5 minutes
Affected Endpoints: POST /login
Dashboard: https://localhost:3000/
Runbook: https://runbook/http-errors
Example Alert Context, sent along with the alert to the configured Notification Channels
- Set a "Runbook URL" linking to documentation on how to properly investigate and mitigate these issues with logins. This can be a link to a Google Docs, an internal documentation website, or even a Grafana dashboard with Text visualizations. Here's a rough example of a runbook:
# Alert: High Error Rate on Logins

## Description
Login attempts are failing with for 5% or more of requests for the past 5 minutes.

## Impact
- User fails to login
- Possible violation of SLA
- Newly created or logged-out users *won't* be able to login
- Users already logged-in *can* still use the app

## Investigation Steps
1. Check for recent changes to the login service
2. Verify database performance metrics
3. Review database and golang service error logs
4. Look for indicators of malicious activity

## Resolution Steps
1. [Immediate Action] Scale up API servers if needed
2. [Investigation] Review slow query logs
3. [Mitigation] Enable cache if applicable

## Escalation Path
1. On-call engineer
2. Database team (if DB-related)
3. Senior SRE lead

## Related Dashboards
- API Performance Dashboard: [link]
- Database Metrics: [link]
Example Runbook for issues with Logins
- Finally, we need to set a notification channel, where this alert will be sent to upon changing its status (e.g. from OK to Error, or when it recovers).
Notification Channels
- By default, Grafana will provide you with an Email contact point, but you'll have to setup email for Alerting.
- Instead, I prefer having an alert sent to a messaging system like Slack or Discord. Let's use Discord for this guide. First, create a discord server and channel where alerts will be sent to. It's recommended that you send alerts to channels where users will pay attention to, that are not too noisy. Creating specific alert channels is OK, but always keep an eye on to make sure they don't become too noisy.
- Once you have a Discord server and channel where you'll send notifications to, go to that channel's Settings by clicking on the cog icon next to the channel's name, and under "Integrations", go to "Webhooks" and add a new Webhook.
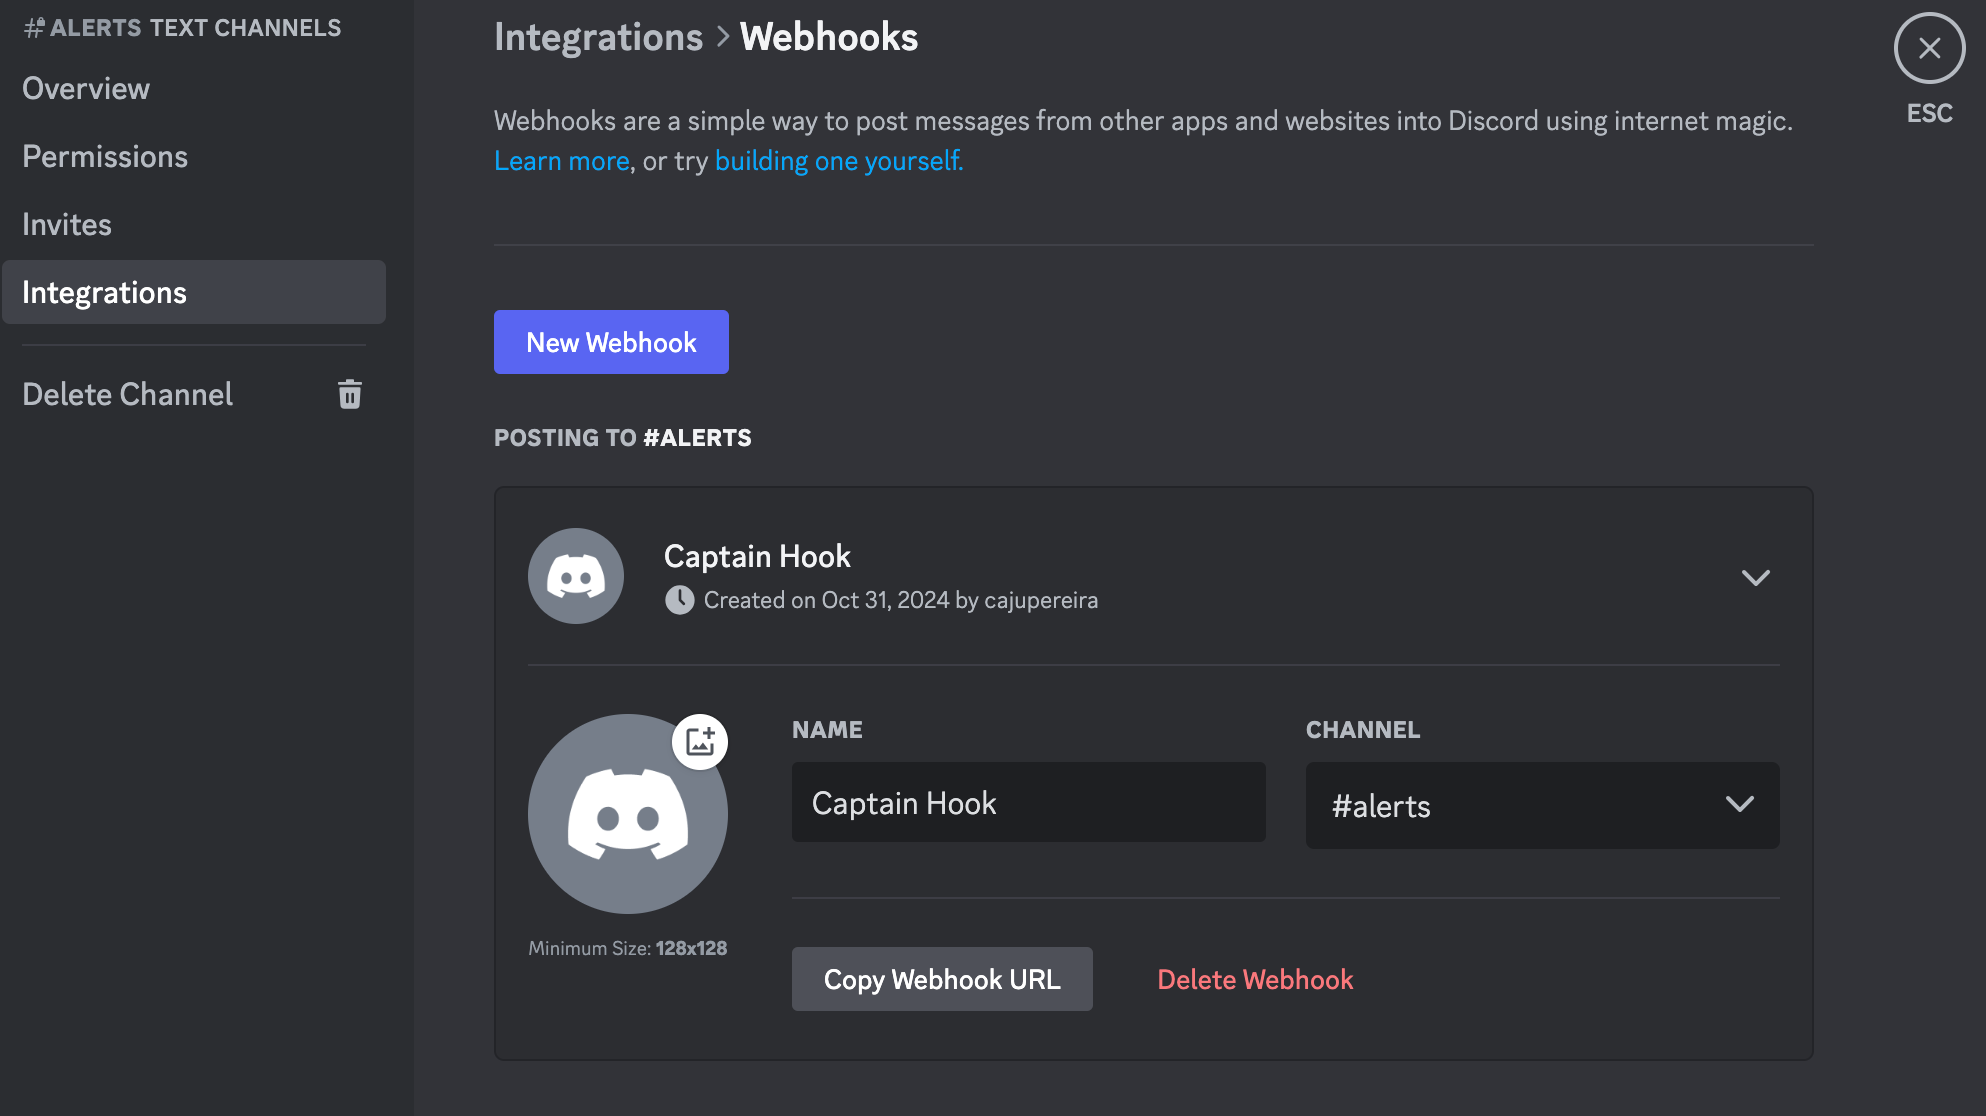
- Once you have your Webhook, click under "Copy Webhook URL" and head over to Grafana, where we'll finish setting up this Contact Point.
- Under the same Create/Edit Alert screen, head over to the "Contact point" section, and click on
View or create contact points. Then, click+ Create contact point. - First, set a unique Name to it such as
Discord #alert channel. Then, under "Integration" selectDiscord, and finally add the Webhook URL you copied earlier from Discord.
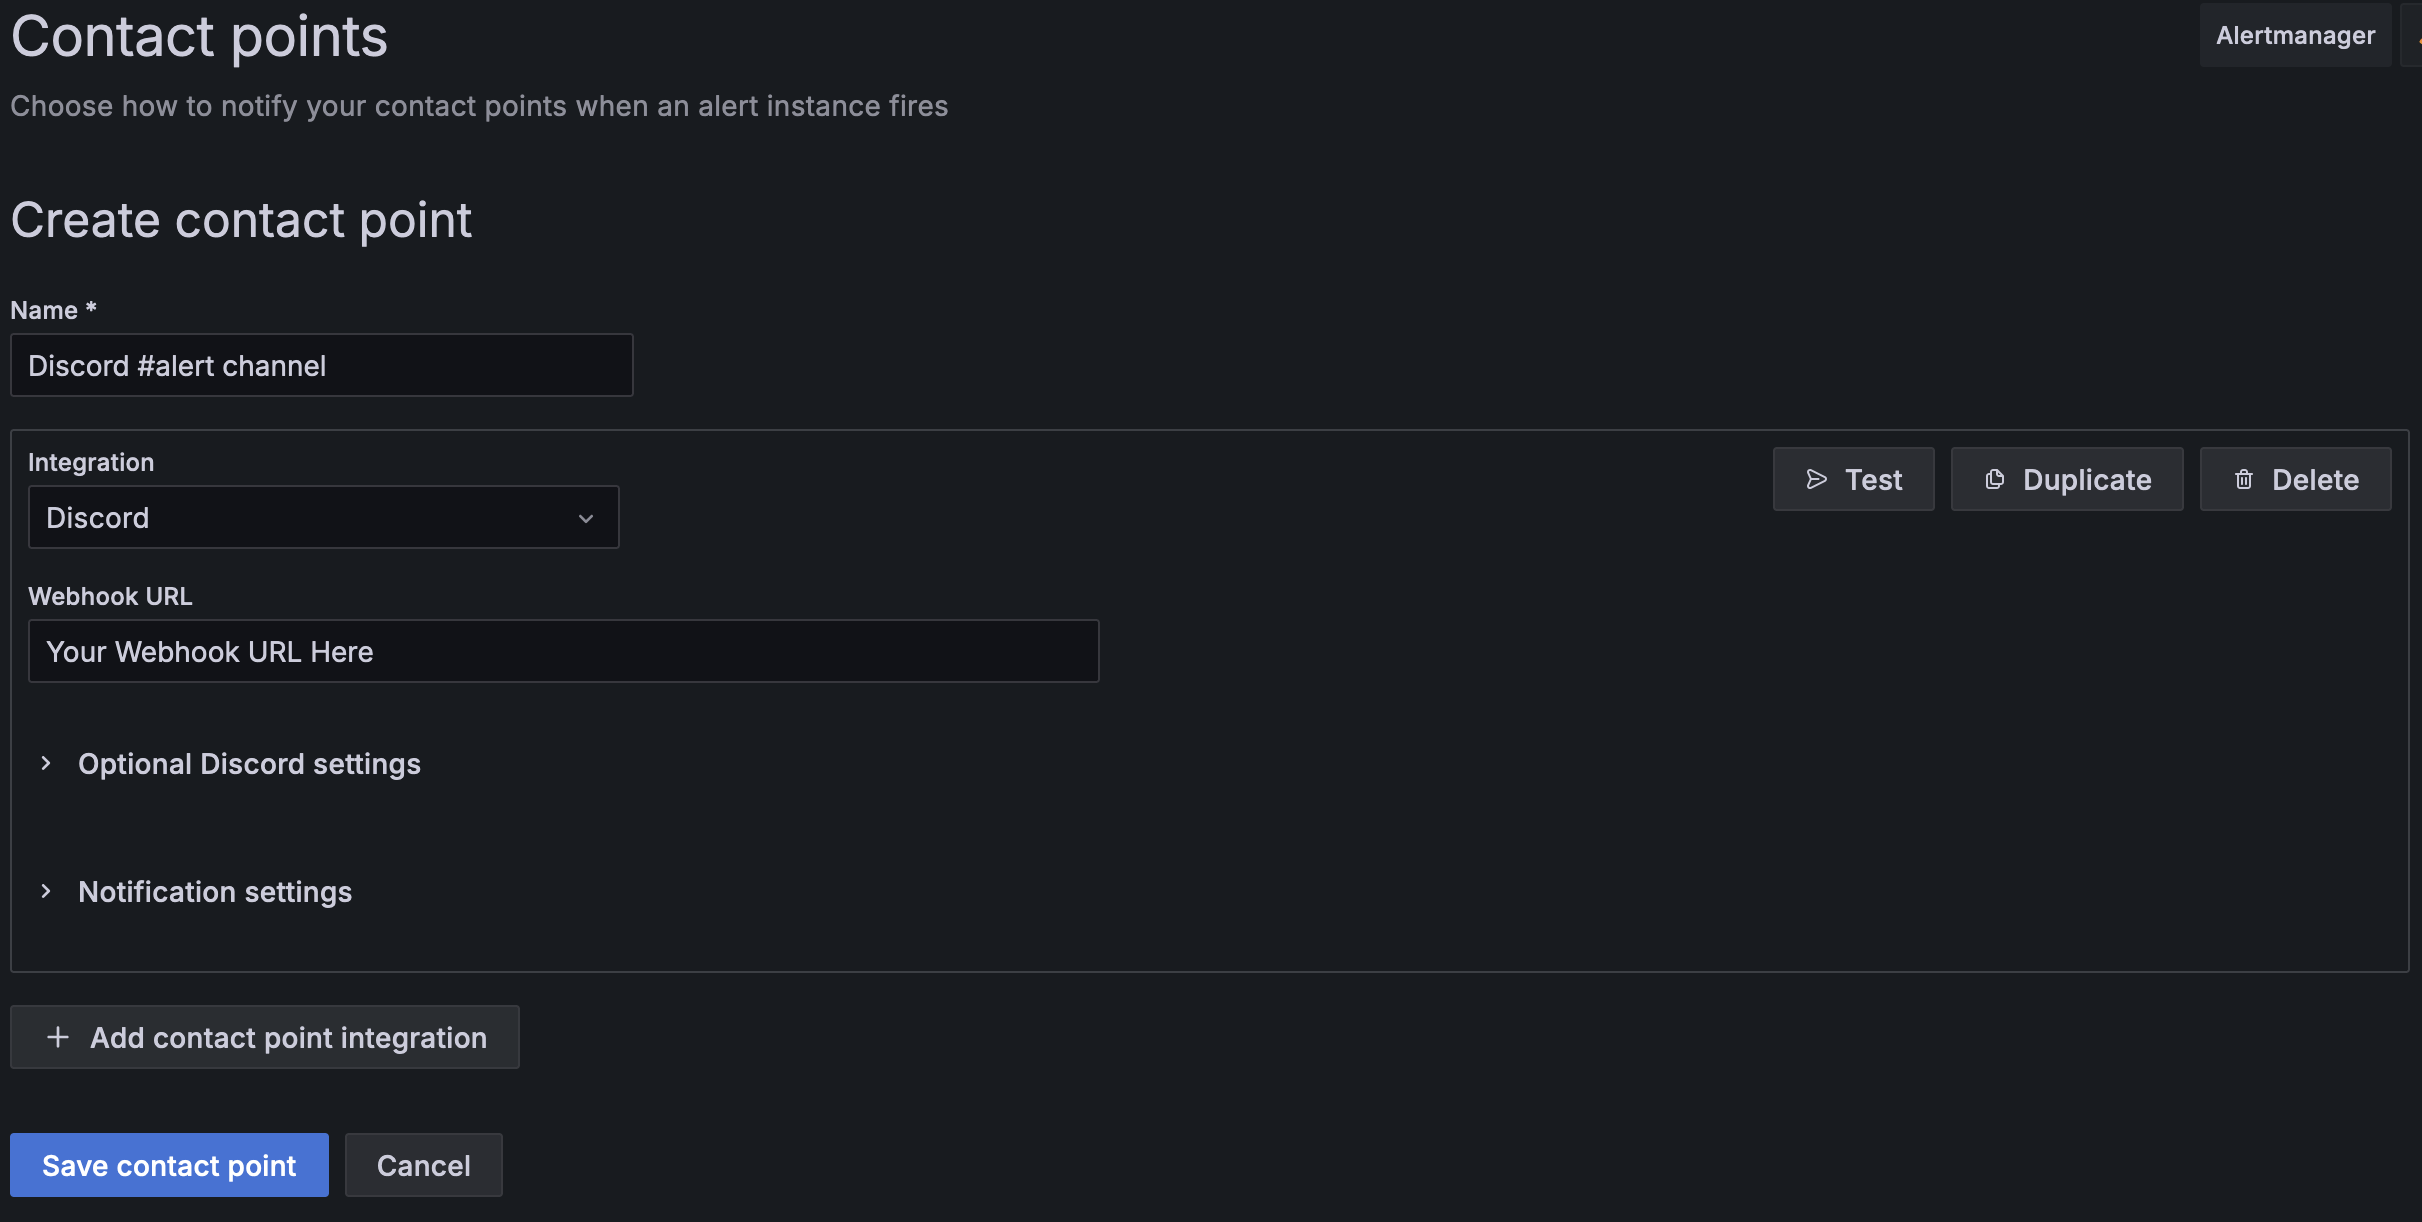
Feel free to run a Test for your notification channel, which will fire a test alert.
If everything goes well, you should see an alert pop-up in your Discord channel.
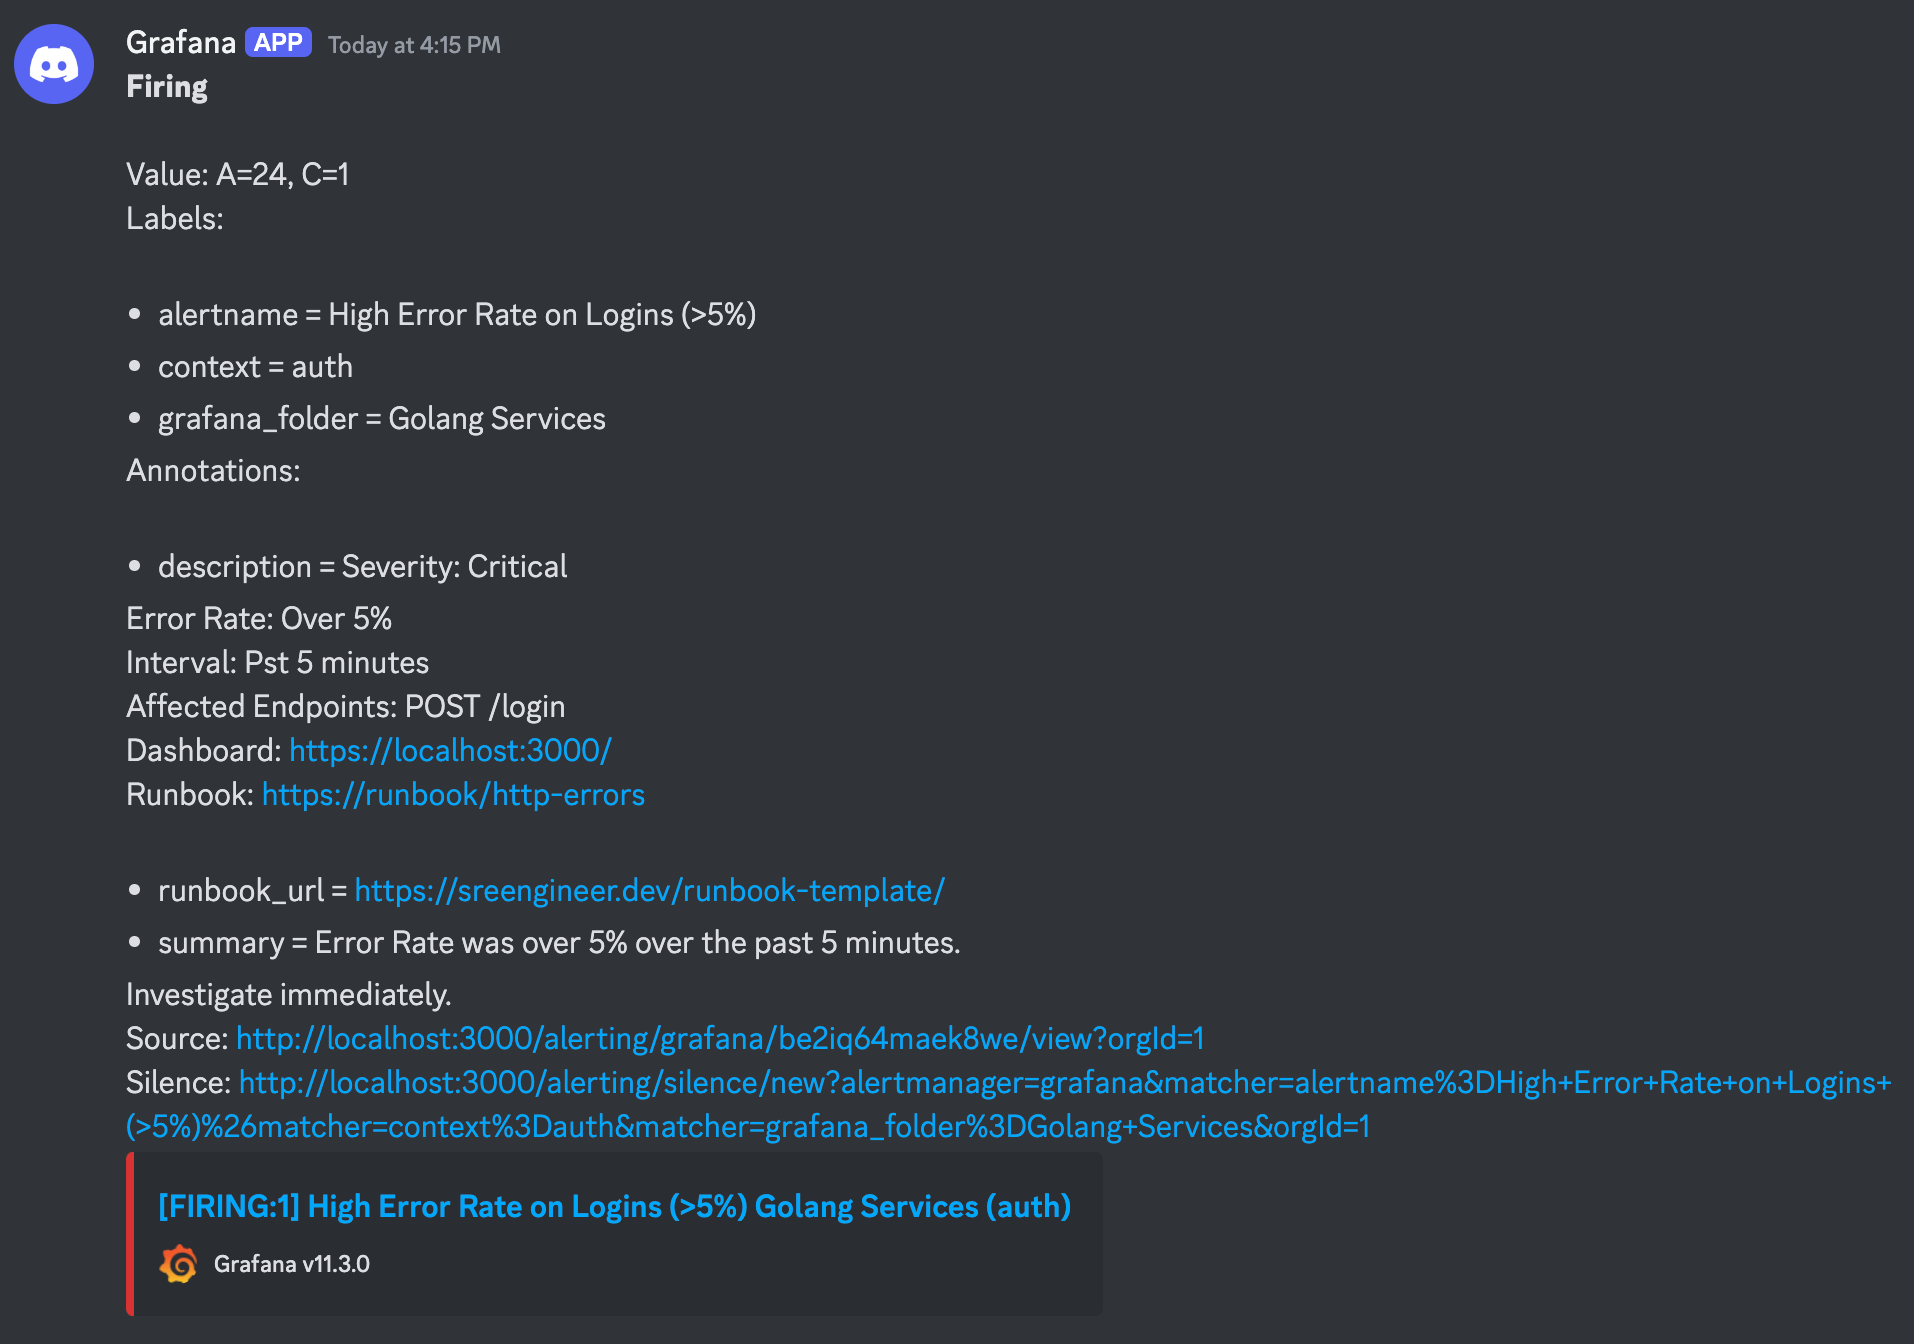
And we're done! You now have a fully working alert that will automatically trigger upon high error rates on logins, along with its criticality level, link to a runbook document, and other helpful information for the on-call engineer.
Security
Security is crucial for monitoring systems as they often contain sensitive operational data and have privileged access to your infrastructure. Before adding monitoring to your production environments, please read the following articles on securing your monitoring stack:
Conclusion
We've successfully set up a robust monitoring stack that covers:
- Infrastructure deployment with Docker Compose
- Instrumentation of a Go service with Prometheus metrics
- Monitoring of the Four Golden Signals
- Custom business metrics
- Grafana dashboards and alerting to custom notification channels
We'll cover some more advanced Grafana and Prometheus concepts in future posts, and improve our service's monitoring with:
- More business-specific metrics, and improved dashboards
- Additional alerting rules
- Logging integration
- Tracing with OpenTelemetry and Grafana Tempo
Remember to check out the previous post on Monitoring Fundamentals for the theoretical background behind these implementations.
Additional Learning Resources
- Observability Engineering: Achieving Production Excellence
- Prometheus: Up & Running: Infrastructure and Application Performance Monitoring
- Prometheus Documentation
- Grafana Documentation
Subscribe to ensure you don't miss next week's deep dive into Service Level Objectives (SLOs). Your journey to mastering SRE continues! 🎯
If you enjoyed the content and would like to support a fellow engineer with some beers, click the button below 😄
